Consumer interest in claiming clean energy grows each year, and with recent proposed updates on temporal matching requirements in accounting and reporting standards (i.e. GHGP and SBTI), there is likely to be growing interest in matching consumer energy use with clean energy production hour by hour. Utilities are already offering these kinds of products throughout the United States, but until now there has been no clear guidance on how to credibly develop them.
That’s why the Clean Energy Accounting Project (CEAP), a program of Center for Resource Solutions (CRS), created the Hourly Clean Energy Utility Product Designs: Nine Product Model Examples—a practical guide to help vertically integrated utilities in the United States design credible, customer-focused hourly clean electricity products.
Nine product options. One matrix.
Not every utility is starting from the same place, and not every customer has the same goals. Some utilities have robust clean energy portfolios and sophisticated data systems. Some face customers demanding more hourly energy products. Others are still building up their clean energy capacity, serving customers who want something accessible and affordable.
The Product Model Matrix below reflects that reality. Every product sits somewhere along two axes: how much risk it puts on the utility and how complex it is to administer. This matrix helps utilities find the right fit for where they are right now.
No matter which model a utility chooses, CEAP’s guidance covers where the generation comes from, how it’s matched to load, what should be disclosed, and what claims can be made.
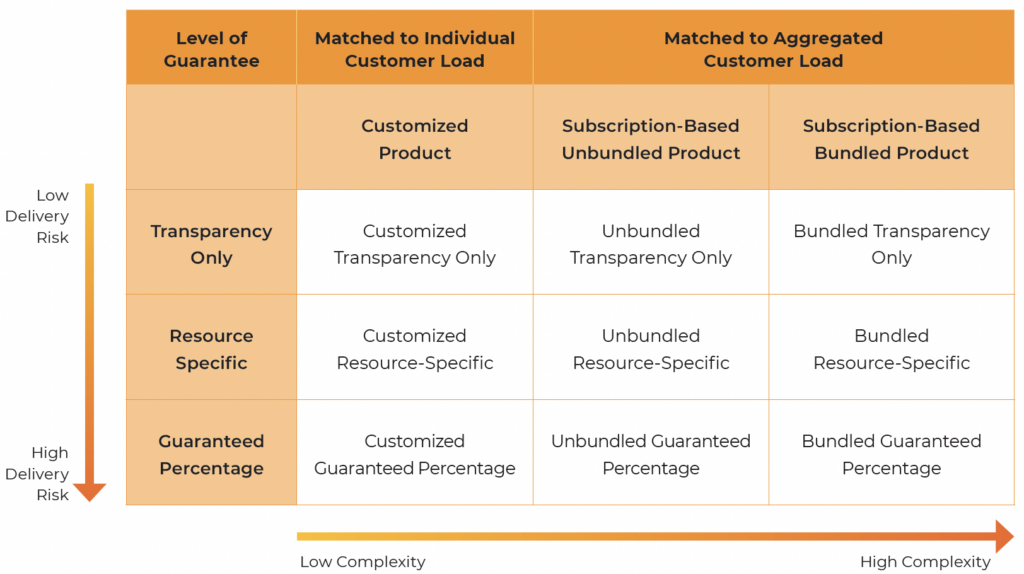
The vertical axis shows the level of guarantee (low to high delivery risk for the utility):
- Transparency Only: Utilities report hourly data and match load to available generation, without guaranteeing a specific matching percentage or resource. This is the lowest risk to the utility but can be a simple entryway for consumers beginning their hourly matching journey.
- Resource Specific: Utilities commit to specific technologies or assets matched to customer load each hour. They won’t guarantee a specific percentage but commit to what’s generating the power and when. This type of model is great for customers whose load profile is similar to the generation profile of particular resource types.
- Guaranteed Percentage: Utilities ensure customers get a set amount of hourly carbon-free electricity, which may or may not be resource-specific. This is the highest risk to the utility, but the most precise offer. This model type is best suited for customers with steady or predictable consumption profiles.
The horizontal axis shows the product structure (low to high complexity for the utility):
- Customized Products: One customer receives a single CFE resource or multiple CFE resources through an electricity supply agreement, which is matched to their load on an hourly basis dependent on the specificity of the risk level and contractual obligation. This allows for greater specificity but on a smaller scale.
- Subscription-Based Unbundled Product: Multiple customers subscribe to a portfolio of CFE attributes. Electricity and certificates can come from different sources, including purchased EACs. It’s important to note here that while the product is “unbundled” from the utility perspective, it’s effectively bundled for the customer(s). This gives utilities the flexibility to serve a wide range of customers.
- Subscription-Based Bundled Product: Multiple customers subscribe to a portfolio of utility owned aggregated or individual generation bundled with associated EACs.
The matrix flows from low risk and low complexity (Customized Transparency Only) to high risk and high complexity (Bundled Guaranteed Percentage). But there is no single right product for a utility to offer. Utilities should consider factors such as generation and resource availability, customer interest, and risk tolerance when selecting a particular product option to offer.
Every product in this matrix is credible. The question is which one is right for each utility and it’s customers. Hourly Clean Energy Utility Product Designs: Nine Product Model Examples helps figure that out.